Customizing beCPG
Deleting unnecessary lists
Repository > Système > Modèles d'entité > Projet
You can delete the unnecessary data lists after clicking « View data lists ».
Creating a new list
To add a new list using the model designer or a xml file, you have to create a model inheriting from bcpg:entityListItem and its associated forms.
In our example we will use the deliverable model.
<type name="pjt:deliverableList">
    <parent>bcpg:entityListItem</parent>
        <properties>
            <property name="pjt:dlDescription">
                <type>d:text</type>
                <mandatory>true</mandatory>
            </property>
Adding a new Gantt view
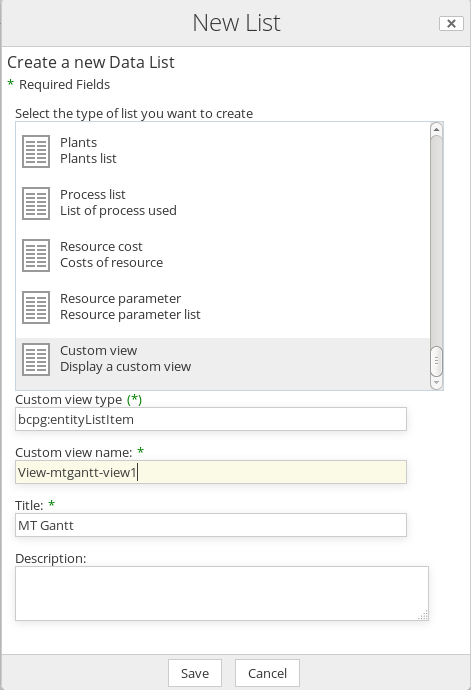
Adding a new gantt view is achieved by adding a new list in :
Repository > Système > Modèles d'entité > Projet

The associated type is the Alfresco type you created. The custom view name has to begin with « View-gantt- ».
Every project inheriting from this model will also have this new gantt view.
The gantt is rendered by a JavaScript function declared in « gantt-columnRenderers.js ».
All gantt renderers are associated to a type. To initialize a new renderer, you have to create a YUI event :
YAHOO.Bubbling.fire("registerGanttRenderer",  {
    typeName : "pjt:deliverableList",
      ganttInitialiser : function(callBack) {
      //TODO
    callBack.call(this);
    }
 });
The ganttInitialiser method gets the legends and creates the Gantt. An example is provided for taskList. Here is the function for the deliverables dispay in Gantt :
ganttInitialiser : function(callBack)
{
    var fnDrawGantt = function PL_onReady_fnDrawGantt()
    {
        var recordSet = this.widgets.dataTable.getRecordSet();
        if (recordSet.getLength() != 0)
        {
            g = new JSGantt.GanttChart('g', Dom.get(this.id + "-gantt"), g != null ? g.getFormat() : 'day');
            g.setDateInputFormat("shortDate");
            g.setDateDisplayFormat("shortDate");
            g.setCaptionType('Caption');
            g.setShowRes(0); // Hides the resources
            g.setShowDur(0); // Hides the duration
            g.setShowComp(0); // Hides the progress
            var start = new Date();
            for (var i = 0; i < recordSet.getLength(); i++)
            {
                var oRecord = recordSet.getRecord(i);
                var deliverable = oRecord.getData();
                var taskId = deliverable.nodeRef;
                var precTaskIds = "";
                var pParent = 0;
                var pGroup = 0;
                var tlIsMilestone = true;
                var tlPercent = 0;
                var start = new Date();
                var end = new Date();
                var color = "006600";
                if (oRecord.getData("color"))
                {
                    color = oRecord.getData("color").replace('#', '');
                }

                var taskOwner = null;

                g.AddTaskItem(new JSGantt.TaskItem(taskId, this.getDeliverableTitle(deliverable,
                        this.options.entityNodeRef), start, end, color, null, tlIsMilestone ? 1 : 0, taskOwner,
                        tlPercent, pGroup, pParent, 1, precTaskIds));
            }

            this.refreshView();

        }
        else
        {
            Alfresco.util.populateHTML([ this.id + "-gantt",
                    "<div class=\"yui-dt-liner\">" + this.msg("message.empty") + "</div>" ]);
        }
    };

    this.extraAfterDataGridUpdate.push(fnDrawGantt);
    this.initTaskHandlers();

    callBack.call(this);
}
And the result :
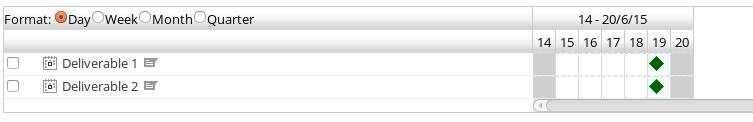
You can also change the default tasks gantt's visual by modifying tasklist's ganttInitialiser function.
Creating a multi gantt view
Since the 1.6.6 version, beCPG has a new datalist extractor that can return more than one list at a time. This is what we will use to achieve a new multi gantt view.
Creating a customized view
To create a customized view in beCPG, you have to write a share webscript in org/alfresco/components/entity-charact-views. Its name must end with « -view ».
<webscript>
    <shortname>Multi Gantt View</shortname>
    <description>Multi Gantt View component</description>
    <url>/components/entity-charact-views/mtgantt-view</url>
</webscript>
You can then add the view to the project model.
The syntax to call the view is « view-{name of the view}-id ». In our example of a view with several lists, we use the parent type bcpg:entityListItem. The full example is in the sources.
Calling the multiList extractor and creating the gantt
In order to create a multi list gantt view, we instanciate in our webscript a JavaScript YUI component defined in « mtgantt-view.js ».
var mtGanttView = {
    id : "mtGanttView",
    name : "beCPG.component.MtGanttView",
    options : {
        entityNodeRef: page.url.args.nodeRef!=null ?page.url.args.nodeRef : ""
      }
};
In this component we connect a YUI datasource to the service « becpg/entity/datalists ».
We want to return the data contained in both our project lists :
- taskList (containing pjt:taskList elements)
- view-gantt-deliverable (containing pjt:deliverableList)
We use the multiList extractor « dataListName=multiList_taskList_View-gantt-deliverable » and « itemType=bcpg:entityListItem ». Full URL :
getWebscriptUrl : function MtGanttView_getWebscriptUrl() {
     return Alfresco.constants.PROXY_URI +
"becpg/entity/datalists/data/node?itemType=bcpg:entityListItem&pageSize="
+ this.options.maxItems
+ "&dataListName=multiList_taskList_View-gantt-deliverable&entityNodeRef="
+ this.options.entityNodeRef;
};
Finally, it is necessary to precise which fields are returned by the extractor :
var request =
{
    fields : [ "bcpg_parentLevel","pjt_tlTaskName", "pjt_tlDuration", "pjt_tlPrevTasks", "pjt_tlState", "pjt_completionPercent", "pjt_tlStart", "pjt_tlEnd", "pjt_tlIsGroup","pjt_tlIsMilestone","pjt_tlResources",
            "pjt_tlTaskLegend|cm_name|bcpg_color", "pjt_dlDescription", "bcpg_color" ],
    page : this.currentPage,
    sort : "bcpg:sort",
    queryExecutionId : this.queryExecutionId
};
We define « pjt:taskList » and « pjt:deliverableList » fields at the same time.
Note : it is possible to return the association fields, in particular to get the legends associated to the tasks with only one call : pjt_tlTaskLegend|cm_name|bcpg_color.
The gantt initialization is then done using the data returned by the webscript. Le full sources are provided.
Note : the sorting has to be done by the client.
The result :
image.jpg
Adding a new button to the toolbar
It's possible to easily add new buttons to the beCPG datalists toolbar.
You have to add a new YUI event in one of the view's JavaScripts. For the gantt view, you can use the file « gantt-view-toolbar.js ». The event to trigger is called « registerToolbarButtonAction ».Then, there is an evaluator that determines for which lists and where (right or left) the button is displayed and finally a function that create the widget or a function to call when the button is clicked. Here is the full-screen button example, there are more provided in the file.
YAHOO.Bubbling.fire("registerToolbarButtonAction",
        {
            actionName : "full-screen",
            evaluate : function(asset, entity)
            {
                return asset.name !== null && (asset.name.indexOf("View-gantt") > -1 || asset.name === "taskList") ;
            },
            fn : function(instance)
            {

                if (Dom.hasClass("alf-hd", "hidden"))
                {
                    Dom.removeClass("alf-hd", "hidden");
                    Dom.removeClass("alf-filters", "hidden");
                    Dom.removeClass("alf-ft", "hidden");
                    Dom.removeClass("Share", "full-screen");
                    Dom.addClass("alf-content", "yui-b");

                }
                else
                {
                    Dom.addClass("alf-hd", "hidden");
                    Dom.addClass("alf-ft", "hidden");
                    Dom.addClass("Share", "full-screen");
                    Dom.addClass("alf-ft", "hidden");
                    Dom.addClass("alf-filters", "hidden");
                    Dom.removeClass("alf-content", "yui-b");
                    Dom.setStyle("alf-content", "margin-left", null);

                }

            }
        });
Associated CSS :
.datalist-toolbar .full-screen span.first-child
{
background: url(../images/fullscreen-enter.png) no-repeat 5px 4px;
}
Customizing the gantt
When initializing the gantt in each view, it is possible to customize its display :
g = new JSGantt.GanttChart('g', Dom.get(this.id + "-gantt"),  'day');
                                                    g.setDateInputFormat("shortDate");
                                                    g.setDateDisplayFormat("shortDate");
                                                    g.setCaptionType('Resource');
Description of the parameters
| g.setFormatArr("day","week","month") | Shows only day, week and month |
| g.setShowRes(0) | Hides the resource column |
| g.setShowDur(0) | Hides the duration column |
| g.setShowSelect(0) | Hides the checkboxes |
| g.setShowComp(0) | Hides the progress date column |
| g.setShowStartDate(0) | Hides the beginning date column |
| g.setShowEndDate(0) | Hides the end date column |
| g.setCaptionType(Caption/Resource/Duration/Complete) | Defines the message type next to a task : - Caption – customized message defined when adding a task (pCaption) - Resource – name of the resource associated to the task - Duration – duration of the task - Complete - % of progress |
| g.setColWidthFactor(1.1) | Increases column size |
You can overload the rendering of the gantt by overloading one of the following models :
renderMile
(vcurrDivID,vTaskLeft,vTaskRight,vDayWidth,vColWidth,vDateRowStr,vCaptionStr,vTask)

 renderTask
(vcurrDivID,vTaskLeft,vTaskRight,vDayWidth,vColWidth,vDateRowStr,vCaptionStr,vTask)

renderGroup
(vcurrDivID,vTaskLeft,vTaskRight,vDayWidth,vColWidth,vDateRowStr,vCaptionStr,vTask)

Example to color all the day box and to have the caption in the box :

g.setColWidthFactor(2); // increases the boxes size
g.renderMile =  function(...){
    return '<div id="bardiv_' + vcurrDivID + '" style="position:absolute;         top:0px; left:' + Math.ceil(vTaskLeft * (vDayWidth))  + 'px; height: 23px;     width:'+vColWidth+'px; overflow:hidden;"><div id="taskbar_' + vcurrDivID +     '" style="width:100%;height:100%;background-color:#' +                                                   vTask.getColor() + ';">'+vCaptionStr+'</div>';
 };